
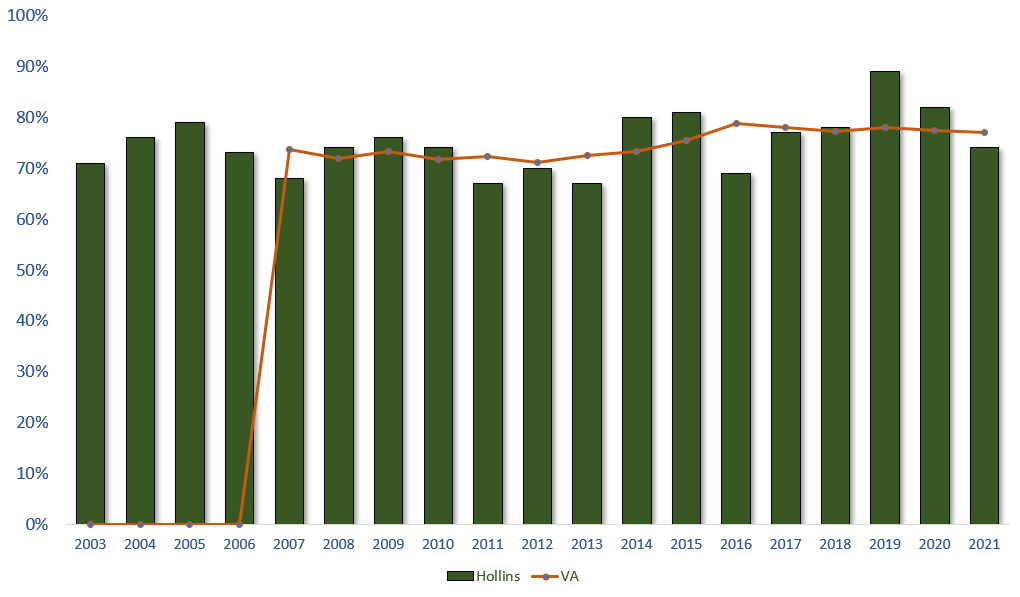
Based on IPEDS Data Trend generator, Hollins University’s fall to fall retention rate has been improving in the past years, with a set back in 2021. Monitoring Hollin’s retention trend in comparison to other non-profit, four year private institution in Virginia provides insight on decisions about retention. In the coming years, Hollins aims to increase its retention rate to 80%.
Chart: IPEDS Retention (Hollins) vs. SCHEV Retention (Across VA)
 Click to enlarge
Hollins University Data Drill
Hollins University data drill its fall to fall retention rate through first-generation, limited income and student of color fields. Clicking on the chart will enlarge it for clarity
Chart 1: First Generation retention trend line
Even though the trend line for first generation students runs parallel to the overall retention rate, it falls below it across all years. The drop in 2015 and 2018 has rippling effect on the graduation rate for this cohort.

Chart 2: Limited Income (LI) retention trend line
Limited Income (LI) students retain less than non-LI students. The disparity between this group percentage points to that of the overall rate at times large (2015. 2018) . In 2021, non-LI students retained much better than LI students.
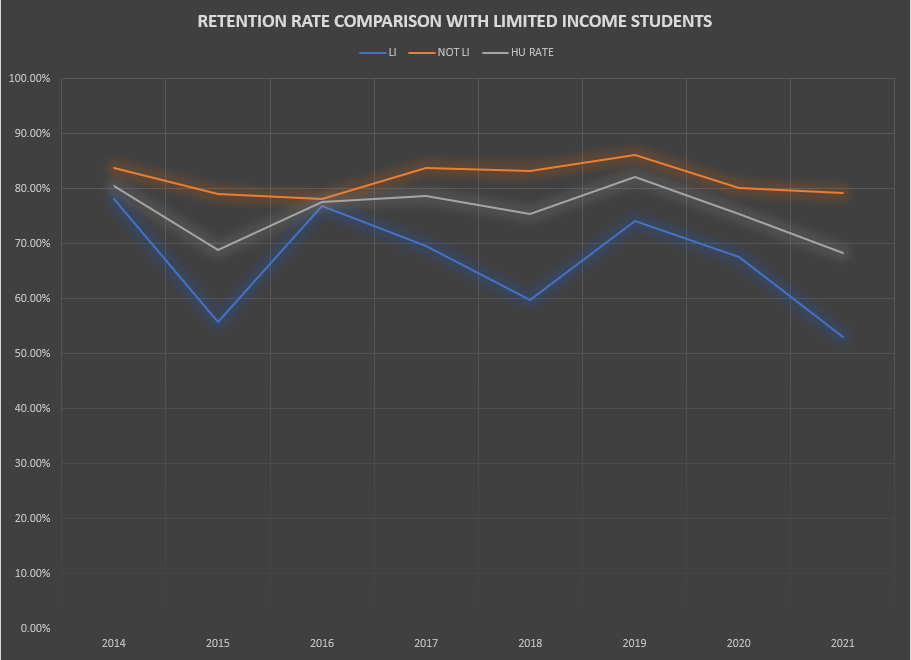
Chart 3: Student of Color (SoC) retention trend line
Student of Color (SoC) trend line tend to run opposite of non-SoC across the years, retaining better in years where non-SoC students have not retained as well.
