
Hollins University tracks its graduation rate using the guidelines set by IPEDS as well as those set by the institution itself.
100% graduation rate represents percentage of first time, full time (FTFT) students in an incoming cohort who graduated within four years of being at Hollins(Note: 150% graduation rate reflects within six years and 200% reflects within eight years).
Table 1: Graduation rate 150% by Ethnicity (IPEDS). Numbers shown reflects the percentage of students in each subcategory that graduated within six years from time of entry at Hollins University.
| COHORT FALL PER ACADEMIC YEAR |
AY14-15 | AY13-14 | AY12-13 | AY11-12 | AY10-11 |
| Overall (%) |
59 | 62 | 66 | 55 | 62 |
| American Indian or Alaska Native | 100 | 0 | 100 | – | – |
| Native Hawaiian/Oth Pacific Islander | 100 | 33 | 83 | 100 | 60 |
| Asian | 100 | 33 | 83 | 100 | 75 |
| Black or African American |
61 | 52 | 67 | 40 | 59 |
| Hispanic | 17 | 56 | 67 | 75 | 23 |
| Two or more races | 56 | 66 | 63 | 55 | 66 |
| White non-Hispanic | 58 | 50 | 60 | 50 | 33 |
| Race/ethnicity unknown | 83 | 50 | – | 33 | 0 |
| Nonresident alien | 89 | 80 | 100 | 67 | 81 |
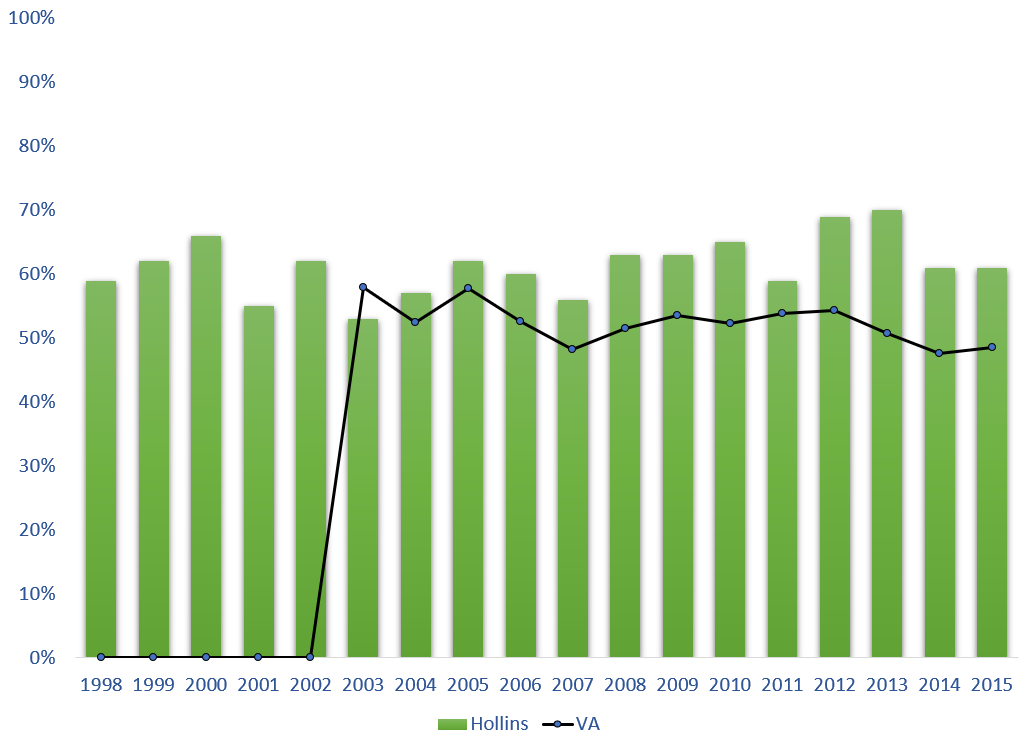
Based on IPEDS Data Trend generator (1998-2021), Hollins University’s graduation rate trends above of other non-profit, four year private institution in Virginia. Even though this is encouraging, the institution aims to improve its six year rate to 70%.
Graduation Rate(150%) – IPEDS (Hollins) vs. SCHEV (Virginia)
 Click to enlarge
Hollins University Data Drill
In addition to IPEDS data reporting, Hollins University data drills its 100% Graduation rate data by first generation, limited income and student of color categories. The trend shown reflects percentage of students within the subgroup who graduated. Across all trends, 2018 cohort has not fared as well as past cohorts. The affects of COVID may have had some impact as most of the students would have been a sophomore at the height of the pandemic in 2020.
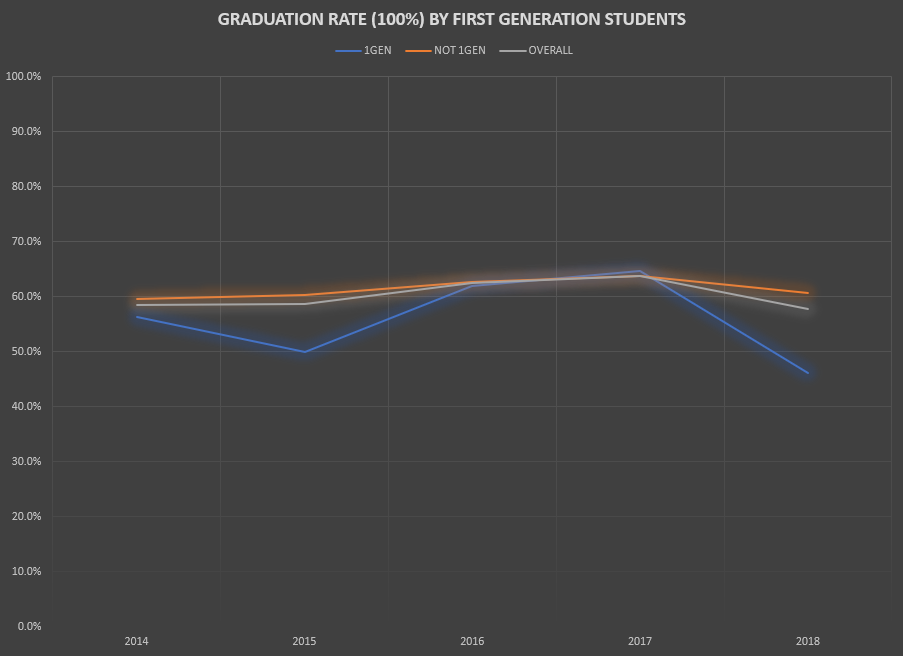
Chart 1: Graduation Rate (100%) trend line by First Generation students (Hollins University).
First generation students’ graduation trend falls below the overall graduation rate whereas non-first generation students’ trend are slightly above the overall trend line. The difference between overall graduation rate and that of first generation was greater for 2015 and 2018 incoming cohorts.
 Click to enlarge
Chart 2: Graduation Rate (100%) trend line by Limited Income (LI) students (Hollins University)
Limited Income (LI) students tend to graduate at a lower rate than the overall cohort. There appears to be a convergence in 2018. It will be important to track whether significant upward trend continues in the coming years for this subgroup.
 Click to enlarge
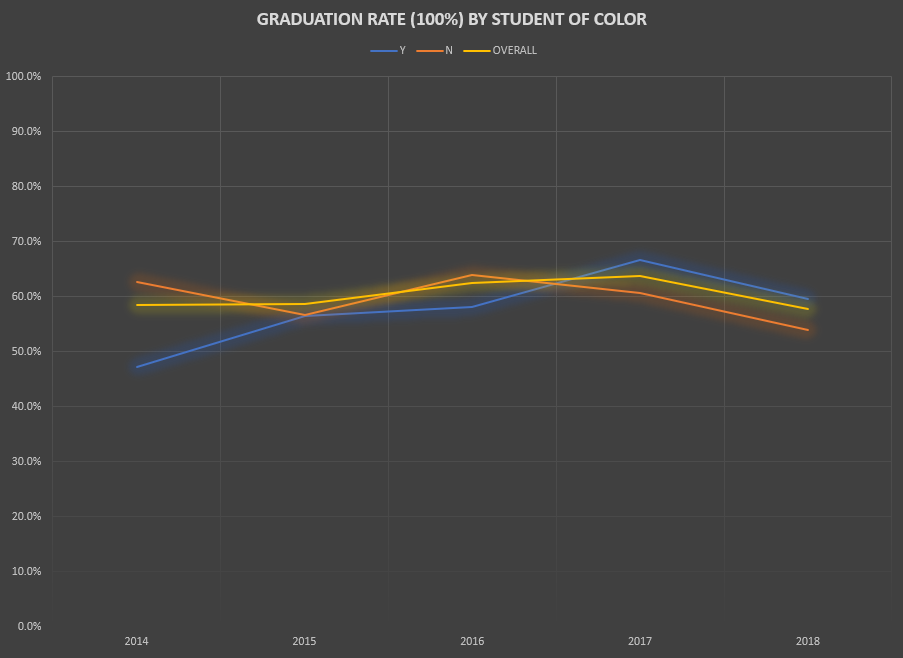
Chart 3: Graduation Rate (100%) trend line by Student of Color (SoC) (Hollins University)
Student of Color (SoC) graduation rate trend has been encouraging. Moving from below the overall graduation trend to exceeding it. Even though the overall trend was was lower than the previous cohort year.
 Click to enlarge